
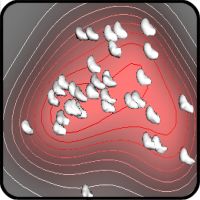
HiGHmed – Interactive Visualization for Infection Control
We develop novel interactive visualization and analysis methods for early detection of pathogen outbreaks and for tracing transmission pathways.
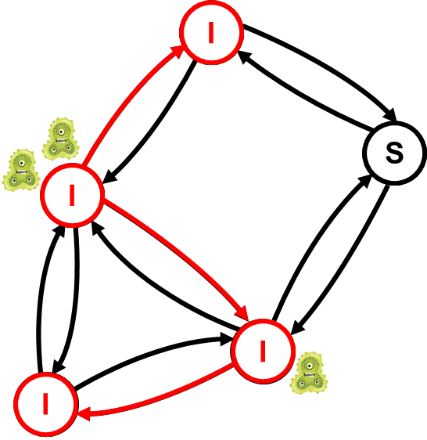
Bacteria and virus outbreaks in hospitals are an important topic in healthcare. Pathogen outbreaks endanger person’s health and cause high costs to the health care system.
Pathogens – bacteria and viruses – are transmitted from patient to patient. As pathogens spread from patient to patient, more and more patients get infected. In this way, thousands of patients get infected in hospitals every year.
It is important to detect pathogen transmission pathways and outbreaks early, to predict future transmissions and to identify putative infected patients.
We support this analysis via novel interactive visualization and data analysis. Our approaches are used by doctors, hygienists and infection control experts.
New project on Data Journalism
The Volkswagen foundation has granted funding to our proposal on Science and Data-Driven Journalism.
Our project entitled „Data Extraction and Interactive Visualization of Unexplored Textual Datasets for Investigative Data-Driven Journalism (DIVID-DJ)“ was selected as one of eight projects to be funded by Volkswagen foundation under the call „Science and Data-Driven Journalism“.
Together with journalists and information scientists of DER SPIEGEL, as well as together with the Language Technology group at TU Darmstadt, we will provide journalists with a novel data analysis tool that combines the latest results from natural language processing (NLP) and information visualization. It will enable journalists to swiftly process large collections of newly gained text documents in order to find interesting pieces of information. Furthermore, the tool will serve as a platform to actually publish the investigation results in a concise way: Readers can access the data that underlay the published piece, which guarantees transparency and credibility.
The tool will build heavily on our previous work on information visualization, namely the Network of the Day.
Recent projects
- Visual exploration of person and organization relationships from news articles
- Visual Analysis of geolocated networks
- Cognitive and perceptual aspects of visual network comparison
- Visual Analysis of Movement Data – Examine Individual and Group Movements extracted from GPS data, twitter data, mobile phone usage
- Visual Analysis of Biologic Networks – Analyze similarities and changes in evolutionary graphs
- Visual Analysis of Network Propagation – Analyze contagion effects in financial networks, assess disease spreading, analyze mutation chains in proteins
- Visual Analysis of Large Graphs – Understanding Networks
Previous projects
- Visual Analysis in Medical Modeling – Supporting creation of organ models
- ViAZ: Visuell-interaktive Analyse von Ausfalleffekten in Zulieferungsnetzwerken
- dataVIAS: Visuell-Interaktive Suche und Analyse von funktionalen Zusammenhängen in großen und komplexen Daten
- Visual Feature Space Analysis – Guided Interactive Comparison of Data Sets
- Visual Search in Research Data – Interfaces for Accessing Content in Digital Libraries
- Visual Cluster Analysis – Visual Control of Clustering and Result Comparison
- PROBADO – Architecture for Content-Based Search in Digital Libraries
- 3D Model Retrieval – Search for Similar 3D Models
The projects are conducted in close collaboration with research and industry partners.
Within project work, we offer student jobs (HiWi), please contact us if interested.
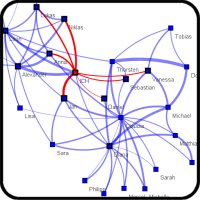
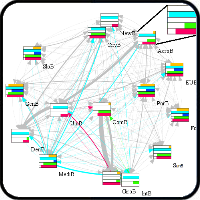
Visual exploration of person and organization relationships from news articles
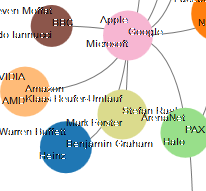
We visualize time-dependent relationships of public agents (persons and organizations) extracted from German online news. The tool provides transparent and intuitive exploration of current events as well as cooperative tagging of relationships. The target group of this tool are journalists, but also broad public such as students, voters and politically interested citizens.
Contact: Tatiana von Landesberger
Cooperation: Prof. Chris Biemann, LT Group, TU Darmstadt, Language Technology group
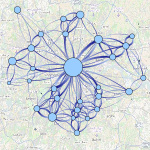
Visual Analysis of geolocated networks
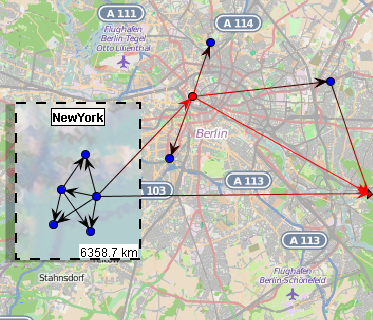
When working with geolocated networks, locations of nodes are fixed when visualizing them. This leads to difficulies in visualization as well as visual analysis, becauses bigger networks will become hard to read, if we can not adjust the layout freely.
We develop techniques for visualization and visual analytics of geolocated networks that try to overcome common problems caused by layouting and overplotting.
Contact: T. von Landesberger
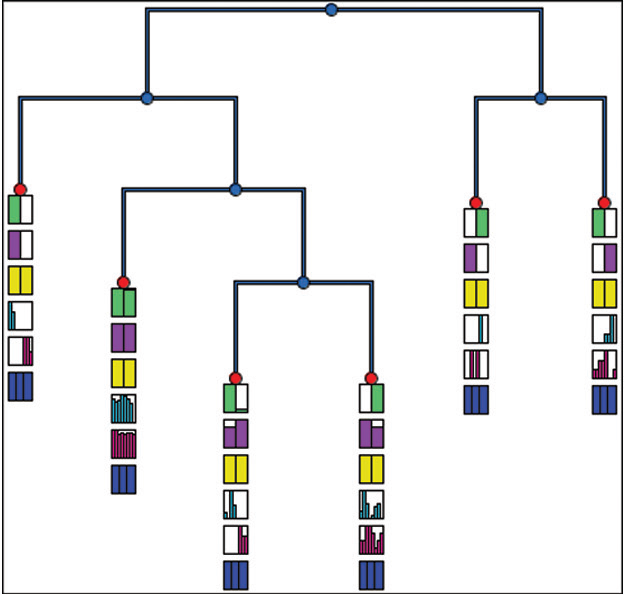
Cognitive and perceptual aspects of visual network comparison
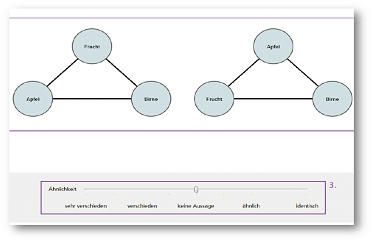
When working with networks a common task is their comparison. By now various visual comparison techniques for node-link diagrams have been developed. But usually with specific applications in mind. Commonalities and differences should be easy to spot, supported by appropriate interaction techniques. Achieving this for the general case is still subject to open research questions. We are conducting a series of user studies in a systematic way to answer these.
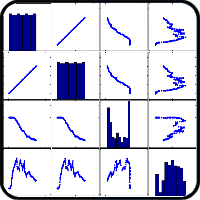
Visual Analysis of Movements
We develop new visualization and data analysis methods for assessing movement data. Movements are extracted from GPS, twitter or mobile phone usage data. We support the visual exploration of object movements and identification of movement patterns both for individual and group movements. Applications include transportation, security, emergency management.
We extract main mobility patterns and show them in interactive visual interfaces.
Contact: T. von Landesberger
Cooperation:
Natalia Andrienko, Gennady Andrienko are with Fraunhofer IAIS, Bonn, Germany and with City University, London, UK.
Andreas Kerren is with Linnæus University, Växjö, Sweden.
Visual Analysis of Biologic Networks – Analyze molecular evolution
We research visual analytis tools suporting biologic research, especially for evolutionary biology. We develop tools for comparison of phylogenetic trees, for analysis of mutation chains in proteins, for exploring mutual information in molecular evolution.
Contact: Tatiana von Landesberger
Cooperation: Prof. Kay Hamacher, TU Darmstadt, Computational Biology Group
Visual Analysis of Network Propagation
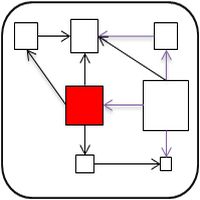
We study network propagation processes. Propagation (also called contagion, cascade, chain reaction) is a process whereby the collapse of a node in a network leads to the collapse of neighboring nodes and thereby sets off a chain reaction in the network. Such processes are studied in, e.g., in financial network analysis, infection diffusion prediction, supply chain management or gene regulation.
We provide novel tools that allow to examine the process of contagion and to compare contagion across the network.
Contact: Tatiana von Landesberger
Visual Analysis of Large Graphs
The goal of the project is to support analysis of large graphs using visual-interactive interfaces. We analyze networks from various areas, such as social web, finance, biology, sociology, transportation, software engineering. We support different analytical tasks: analysis of topology, understanding of graph structure, examination of dynamics, what-if-scenarios, subgraph finding, comparison of many graphs etc.
Contact: Tatiana von Landesberger
Visit Project Page || Related Publications
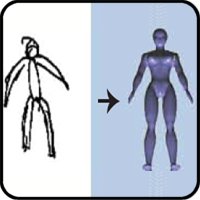
Visual Analysis in Medical Modeling – Supporting creation of organ models
The aim of this project is to develop new Visual Analytics methods for fitting statistical shape models (SSMs). These models are helful in various medical applications, e.g., in treatment planning or computer-aided diagnosis. For building an SSM, models have to be selected that fit the training data well. Due to the lack of prior information, standard models are frequently chosen which may not describe the data in an optimal way. We develop new Visual analytics methods for improving this modeling process.
Contact: Tatiana von Landesberger
ViAZ: Visuell-interaktive Analyse von Ausfalleffekten in Zulieferungsnetzwerken
This project deals with default effects in supply chain networks. Manufacturing and assembly processes usually rely on complex supply chains. Understanding, analyzing and subsequently preventing cascading default effects in supply chains using visual interactive methods is the main focus of this project. It is funded within the SoftwareCampus.
Contact: Sebastian Bremm, Matthias Eggert, Tatiana von Landesberger
Visit SoftwareCampus Page || Related Publications
dataVIAS: Visuell-Interaktive Suche und Analyse von funktionalen Zusammenhängen in großen und komplexen Daten
In the scope of this project, we develop new methods for retrieval in large collections of multivariate data. Such data arises in many different field and disciplines, and efficient, visual-interactive retrieval techniques are important to enable users to find the data they are interested in. This project is funded within the SoftwareCampus.
Contact: Maximilian Scherer
Visual Feature Space Analysis
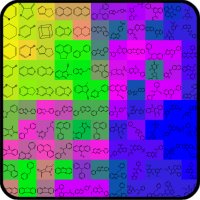
The goal of the project is to enable users to analyze and compare various data sets. These data sets often represent the same objects (e.g., biochemical structures) in a different way. We combine both interactive visualization and data analysis methods to show the most important data properties. In this way, the commonalities and differences between data, e.g., among phylogenetic trees, chemical structures or graphs can be easily identified.
Contact: Sebastian Bremm, T. von Landesberger
Visit Project Page || Related Publications
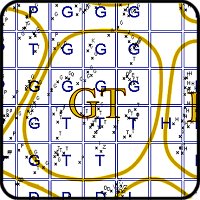
Visual Search in Research Data
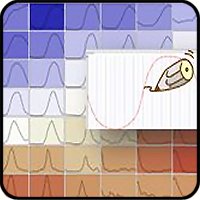
The goal of this project is develop new techniques for search and presentation of scientific data stored in digital libraries. We focus on content-based visual search and presentation of time-oriented data. We deal with primary research data in domains such as meteorology, earth observation, etc.. We amend metadata-based search with visual means of data access. We introduce new data access concepts such as a visual data catalogue and sketch-based search for time-dependent data.
Contact: Tatiana von Landesberger
Visit Project Page || Related Publications
Visual Cluster Analysis
Cluster analysis offers overviews of large data sets, by finding and presenting only a limited number of cluster prototypes to the user. Visualization allows interactive exploration of the clustering results. In this project, we develop a visual cluster analysis framework which lets the user monitor and control the overall clustering process by visual-interactive means. Thereby, it is possible to understand why the given results are obtained. We currently consider the Self-Organizing Map algorithm.
Contact: T. von Landesberger
Visit Project Page || Related Publications
PROBADO – Architecture for Content-Based Search in Digital Libraries
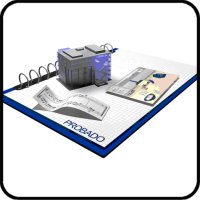
The goal of the project PROBADO is to make multimedia documents (e.g. images, video, 3D models) accessible by content, rather than relying on availability of textual metadata or annotations. We develop new user-interfaces, retrieval methods and distributed system architecture that allow scientific libraries to integrate multimedia documents into their existing workflows. PROBADO specifically supports music documents and 3D architectural data, but is easily extensible to other data types.
Contact: Prof. D. Fellner, T. von Landesberger
Visit Project Page || Related Publications
3D Model Retrieval
3D models are created in many applications such as Computer Aided Design, Architecture, Visualization, Entertainment. These models are stored in large repositories, that need to offer access to these data. We develop methods for 3D model retrieval based on global shape descriptors and contours.
Contact: A. Kuijper, M. Scherer, T. Schreck
Visit Project Page || Related Publications
