
Cluster analysis offers overviews of large data sets, by finding and presenting only a limited number of cluster prototypes to the user. Visualization allows interactive exploration of clustering results. In this project, we develop a visual cluster analysis framework which lets the user monitor and control the overall clustering process by visual-interactive means. Thereby, it is possible to understand why the given results are obtained. We currently consider the Self-Organizing Map algorithm.
Contact: Tatiana von Landesberger, Application Domains: finance, geo and earth observation, natural sciences, biology, etc.

Data Types
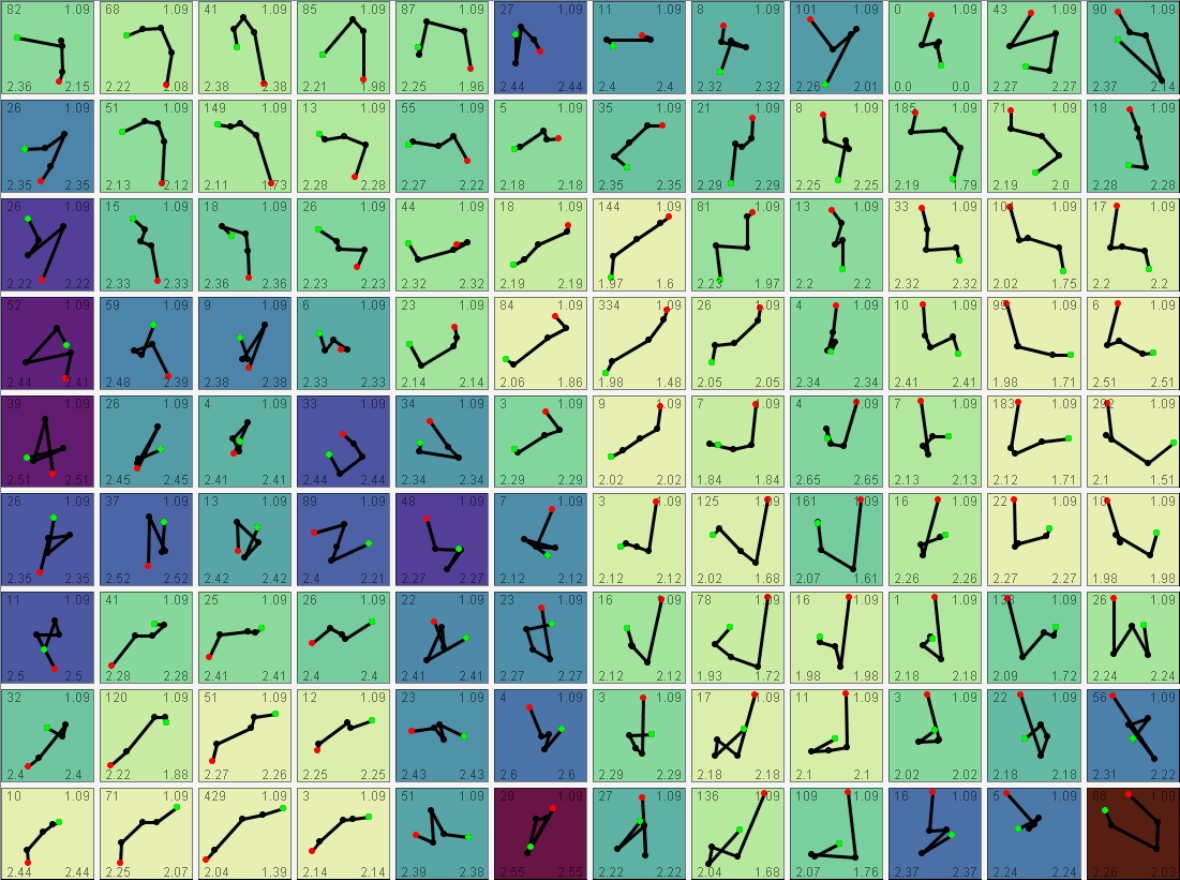
Trajectory Data
Finance: changes of Risk Return values over time
Motion Capturing: analysis of motion behavior over time [Reference: HDM05]
High Dimensional Data
Speech recognition: grouping of spoken letter data elements [Reference: ISOLET]
Univariate Time Series Data
Earth observation: analysis of daily temperature patterns [Reference: PANGAEA]
Bivariate Time Series Data
Earth observation: correlation of measurements of two different physical units [Reference: PANGAEA]
Multivariate Time Series Data
Earth observation: analysis of time-oriented multidimensional measurement data [Reference: PANGAEA]
Motion Capturing: analysis of motion behavior over time [Reference: HDM05]
Sequence Data
Material science: analysis of light-reflectance behaviors
Publications
A Visual Digital Library Approach for Time-Oriented Research Data
J. Bernard, J. Brase, D. Fellner, O. Koepler, J. Kohlhammer, T. Ruppert, T. Schreck, I. Sens
To appear in: Proceedings of European Conference on Research and Advanced Technology for Digital Libraries (ECDL), September 2010
Micro-Macro Views for Visual Trajectory Cluster Analysis
J. Bernard, T. von Landesberber, S. Bremm, T. Schreck
In: IEEE Information Visualization, 2009
Visual cluster analysis of trajectory data with interactive kohonen maps
T. Schreck, J. Bernard, T. Von Landesberger, J. Kohlhammer
In: Information Visualization 8(1) 14 – 29, 2008
