
Data comparison in various domains can be effectively supported by visual analytics solutions combining interactive visualization and algorithmic analysis. We develop novel approaches for interactive visualization and exploration of multiple graphs, time series and 3D data
Applications:
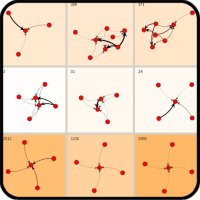
- Transportation (transport situation across days and hours),
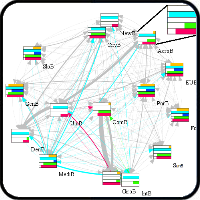
- biology (e.g., phylogenetic trees, mutation graphs )
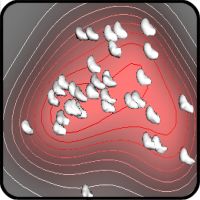
- medicine (segmentation results)
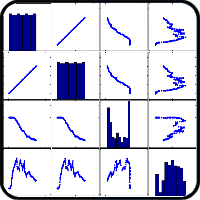
- meteorology (weather situation across areas and time moments)
Visual Comparison explained
Spatio-temporal visualization allows fast and understandable analysis and presentation of the movement data for support of various analytical tasks. The tasks may concentrate on the examination of the movements or finding frequent/unusual movement patterns.