
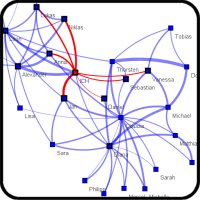
We support analysis of large graphs using visual-interactive interfaces. We visualize networks from various areas, such as social web, finance, biology, sociology, transportation, journalism. We support different analytical tasks: exploration of network topology, understanding of graph structure, examination of network dynamics, what-if-scenarios, subgraph finding, comparison of many graphs etc.
- Visual Analysis of Network Structure – Exploration of relations
- Visual Analysis of Graph Motifs – Finding frequent network structures (building blocks)
- Visual Analysis of Network Changes – Graph evolution over time and what-if-scenarios
- Visual Graph Aggregation – Graph Simplification via collapsing of nodes, various levels of detail
- Visual Analysis of Multiple Graphs – Finding similarities among graphs, graph comparison
- Visual Graph Query – Smart definition of graph queries
- Visual Analysis of Contagion – Simulation and Exploration of Contagion in Networks
- Tracking of graph exploration – Interaction history tracking and visualization
- Perception of network visualization
Visual Network Analytics explained
Visual graph analysis allows fast and understandable analysis and presentation of the graph data for support of various analytical tasks. The tasks may concentrate on the examination of relations between entities, on the occurrence of certain structures in the graph, on the effects of graph changes, on the comparison of many graphs and, depending on the use case, further analytical questions. The analysis can be performed at multiple levels of abstraction.