
Visual graph analysis allows fast and understandable analysis and presentation of the graph data for support of various analytical tasks. The tasks may concentrate on the examination of relations between entities, on the occurrence of certain structures in the graph, on the effects of graph changes, on the comparison of many graphs and, depending on the use case, further analytical questions. The analysis can be performed at multiple levels of abstraction.
Applications: finance, biology, sociology, transportation, software engineering,…
Projects within visual graph analysis
- Visual Analysis of Network Structure – Exploration of relations
- Visual Analysis of Graph Motifs – Finding frequent network structures (building blocks)
- Visual Analysis of Network Changes – Graph evolution over time and what-if-scenarios
- Visual Graph Aggregation – Graph Simplification via collapsing of nodes, various levels of detail
- Visual Analysis of Multiple Graphs – Finding similarities among graphs, graph comparison
- Visual Graph Query – Smart definition of graph queries
- Visual Analysis of Contagion – Simulation and Exploration of Contagion in Networks
- Tracking of graph exploration – Interaction history tracking and visualization
The projects are conducted in close collaboration with research and industry partners. Within project work, we offer student jobs (HiWi), praktikas, bachelor and master theses, please contact Tatiana von Landesberger if interested.
Visual Analysis of Network Structure
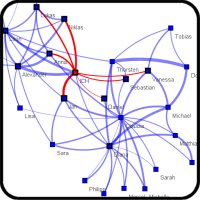
We support the exploration of graphs, focusing on tasks in the analysis of connections and paths (finding parent nodes, finding connecting paths, identification of common child nodes, ….). Our approach combines algorithmic graph analysis and interactive graph visualization. We applied our approach on, e.g., financial and biological networks.
video, Paper (PDF)
Visual Analysis of Graph Motifs
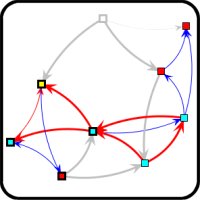
Our work supports visual analysis of graph motifs. Motifs are graph substructures (patterns) that are of interest. They often carry functional information for different graph classes or occur with a high frequency in the network. For example, the so called "feedback motif'' has information filtering properties in biologic networks. We algorithmically indentify location and frequence of user-selected motifs in the graph and show the results to the user in the context of the whole graph. Thereby the user may analyse the occurence of various motif types in the network.
video, Paper (PDF)
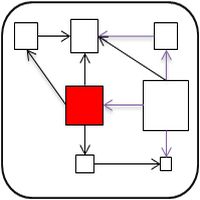
Visual Analysis of Network Changes
Our work analyzes and visualizes graph changes and their impact on graph structure. In the graph, vertices and edges may be deleted, added or modified (attribute values are changed). We focus on both data- and user-driven graph changes (graph evolution over a certain time period or what-if-analysis).
1. Graph dynamics: animation with highlighting of changes video
2. User-defined changes (what-if-analysis): impact on network structure, in particular on graph motifs.
video, Paper (PDF)
Visual Graph Aggregation
Graph aggregation is often employed for visualization of large graphs as it provides simplification of the original graph. Suitable graph aggregation can support analysis on higher levels of abstraction. For example, in shareholder networks, groups of companies from each sector can be merged and thereby allowfor analysis of inter-sectoral relationships in the economy. We offer interactive graph aggregation based on user-defined node groups, on graph motifs and node properties (e.g. sectors).
video, Paper (PDF)
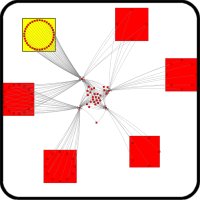
Visual Analysis of Multiple Graphs
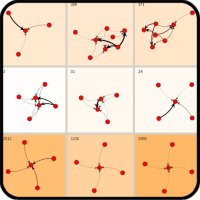
We focus on comparison of a set of graphs: identification of similar graphs. We developed a novel approach for interactive visualization and exploration of multiple graphs based on clustering. It offers an overview of the main types of graphs in the data set. The Self-Organizing Map (SOM) algorithm is used. The system offers exploration of the graph space by interactive visualization of the feature space, clustering results and clustering quality.
video, Paper (PDF)
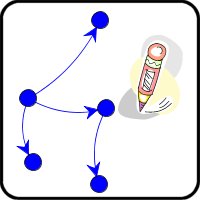
Visual Graph Query
We focus on definition of queries for finding relevant graphs in large graph databases. We developed a new technique for defining the query graph quickly and effectively so that it matches meaningful data in the database. We support query by example selection starting from an overview of the graph types in the database, second query by sketch combining graph building blocks (i.e., topologic subgraphs) with free graph drawing, and third a combination of both approaches.
Paper (PDF)
Visual Analysis of Contagion in Networks
We study contagion in networks. Contagion is a process whereby the collapse of a node in a network leads to the collapse of neighboring nodes and thereby sets off a chain reaction in the network. Such processes are studied in, e.g., in financial network analysis, infection diffusion prediction, supply chain management or gene regulation. We propose a system, which includes the contagion simulation and visualization. We are able to compare the evolution of the different contagion processes. We focus on financial networks, however, our system can be applied to other use cases as well.
Video, Paper pre-print (PDF)
Tracking of Graph Exploration Activities
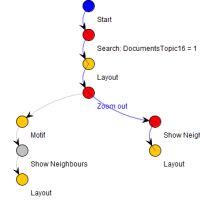
Visual Analysis of graphs consists of several interactive steps. Such a data analysis process is not streamlined, but consists of several steps and feedback loops. In order to be able to optimize the process, identify problems, or common problem solving strategies, recording and reproducibility of this process is needed. This is facilitated by tracking of user actions categorized according to a taxonomy of interactions.
Prepublished Paper
