
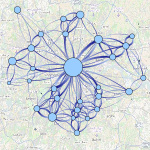
When working with geolocated networks, locations of nodes are fixed when visualizing them. This leads to difficulies in visualization as well as visual analysis, becauses bigger networks will become hard to read, if we can not adjust the layout freely.
We develop techniques for visualization and visual analytics of geolocated networks that try to overcome common problems caused by layouting and overplotting.
Contact: Felix Brodkorb
Publications
Visual Analysis of Mass Mobility Dynamics
Learning more about people mobility is an important task for official decision makers and urban planners. Mobility data sets characterize the variation of the presence of people in different places over time as well as movements (or flows) of people between the places.
We have developed a graph-based method, called MobilityGraphs, which reveals movement patterns that were occluded in flow maps. It combines spatial and temporal simplifications with interactive data views.
Website, Publication:
Cooperation:
Natalia Andrienko, Gennady Andrienko, Fraunhofer IAIS, Bonn, Germany and with City University, London, UK.
Andreas Kerren, Linnæus University, Växjö, Sweden.
Overview with Details for Exploring Geo-located Graphs on Maps
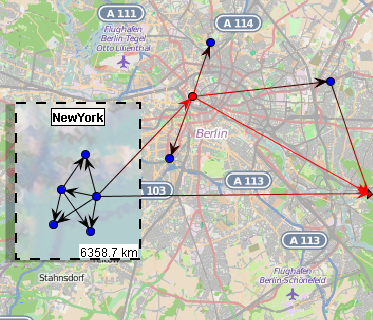
To overcome map visualization problems like overplotting and parts of the network being layouted out of the screen, we developed an interactive graph drawing technique that overcomes these problems without affecting the overall geographical structure of the graph. We use insets to visualize details of small or remote areas and introduce a local area re-arrangement to improve visualization of small areas.
