
Visual graph analysis allows fast and understandable analysis and presentation of the movement data for support of various analytical tasks. The tasks may concentrate on the examination of the movements or finding frequent/unusual movement patterns. We focus on analysis of movements of people/objects individually or in a group, movements of whole groups and changes between groups.
Applications: transportation, emergency management, sociology, time-dependent correlation analysis, biology (e.g., bird movement, )…
- Individual Movements: Exploration of typical patterns in individual movements
- Individual Movements: Analysis of individual movements within a group
- Group Movements: Analysis of Group movements – analysis of a single group and comparison of several groups
- Group Movements: Analysis of Group Changes – Examination of movements between groups
The projects are conducted in close collaboration with research and industry partners.
Within project work, we offer student jobs (HiWi), praktikas, bachelor and master theses, please contact us if interested.
Contact: Tatiana von Landesberger
Visual Analysis of Mass Mobility Dynamics
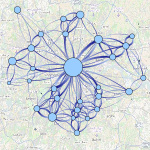
Learning more about people mobility is an important task for official decision makers and urban planners. Mobility data sets characterize the variation of the presence of people in different places over time as well as movements (or flows) of people between the places.
We have developed a graph-based method, called MobilityGraphs, which reveals movement patterns that were occluded in flow maps. It combines spatial and temporal simplifications with interactive data views.
Website, Publication:
Cooperation:
Natalia Andrienko, Gennady Andrienko, Fraunhofer IAIS, Bonn, Germany and with City University, London, UK.
Andreas Kerren, Linnæus University, Växjö, Sweden.
Exploration of typical patterns in individual movements
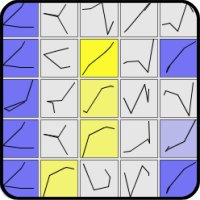
We focus on visual analysis of movements -- identification of frequent or unusual movement patterns of indivisual objects. We thereby rely on clustering combined withdata visualization technique. Clustering provides an overview of typical movement patterns. Several analytical views for detailed data exploration – filtering by object, by time or by transition between consecutive patterns.
Paper 1, Paper 2, Paper 3 Visual Cluster Analysis of Trajectory Data With Interactive Kohonen Maps
We have also analyzed perception of movements in scatterplots.
Analysis of individual movements within a group
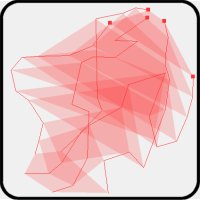
We analyze individual movements and positions within a group. For example, it is relevant whether the object moves together with the group, it remains in the center or at the border of the group. We developed a new technique – monitoring certain statistical properties for each object and for the group over time. The output of the statistic analysis is used for identification of interesting data views. The data is interactively visualized using various techniques.
Video, Paper (PDF)
Analysis of group movements – single groups and comparison of several groups
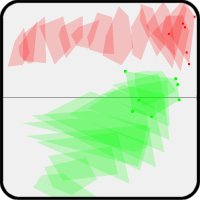
We analyze movements and relative positions of groups. For example, whether and which groups co-move, whether groups' overlap increases. We use monitoring of certain statistical properties for each group and for set of groups. The output of the statistic analysis is used for identification of interesting data views. The data is interactively visualized using various techniques.
Video, Paper (PDF)
Analysis of Group Changes
We develop techniques for visual analysis of group changes over time. Often, the analyzed data objects belong to groups (e.g., animal herds, clusters). Group membership may change over time. We examine and track these changes (e.g., which herds change members and when). We also consider added and removed objects (e.g., newly born or died animals). We automatically select interesting time points and group changes for detailed examination. Application: biology, emergency management.
